
TouchGraph provides a hands-on way to visualize networks of interrelated information. The technology is based on the believe that “Existing data sets can reveal new insights when visualized effectively”. It facilitates information discovery by integrating graphic visualization with traditional table and tree components. The technology can be connected to any on-line or off-line data source to generate reports in formats ranging from Excel spreadsheets to images to PDF files.
TouchGraph was founded in 2001 with the idea to create visual browser for Google.
Some of the implementation of TouchGraph technology are :
- TouchGraph Facebook
- It lets you see how your friends are connected, and who has the most photos together.
- TouchGraph Google
- It reveals the network of connectivity between websites, as reported by Google’s database of related sites.
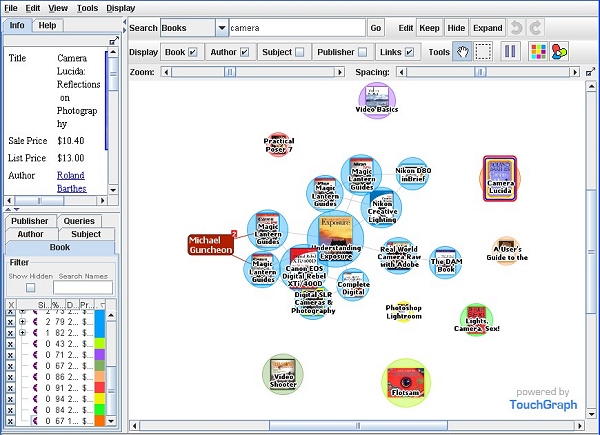
- TouchGraph Amazon
- It reveals the intricate network structure within purchase pattern recommendations
Screenshots
TouchGraph Facebook
TouchGraph Google
TouchGraph Amazon